
One of the more challenging aspects of becoming an engineer is learning how to design and implement experiments versus simply running experiments as designed. Throughout high school and the early part of college, experiments are assigned, as a recipe to follow. Typically, the student is given a set of instructions and they go through each step sequentially. Throughout their academic careers, the complexity of the steps and the meaning drawn from the results increases.
There is only so much that can be learned from following a set of steps. In industry and in graduate work, the new engineer quickly learns that they must design experiments instead of merely following canned steps. Often, they must take down a piece of production equipment, and must be able to collect as much useful data as possible in the shortest amount of time.
This article is about a junior design project where a group of three students must come up with solutions and design their own experiments versus following predetermined steps. The students have one semester (and for one credit) to collect data for an outside contact. Half-way through the semester, the author helped them redesign their experiments. As with many such projects, the students were given a project statement and then left with an open-ended task; they must develop a solution and present it to the outside contact and faculty at the end of the semester.
Caveats
The data collected by these students is non-critical; a side project for an outside contact. If life, limb or property was at stake, more thorough data collection methods and analysis would be required. However, for a one-credit course, this will be adequate. Furthermore, the author has stripped some of the key information away, such as numbers and units on graphs, chemical compositions and the like to protect intellectual property.
Problem statement
In this experiment, the students are testing the etch rate of a copper alloy in a proprietary etchant. They cut out thin strips of metal, weigh them with a microbalance and then immerse them in the etchant for a set amount of time. Then, they rinse off the etchant, dry the sample and weigh it again, recording the weight loss.
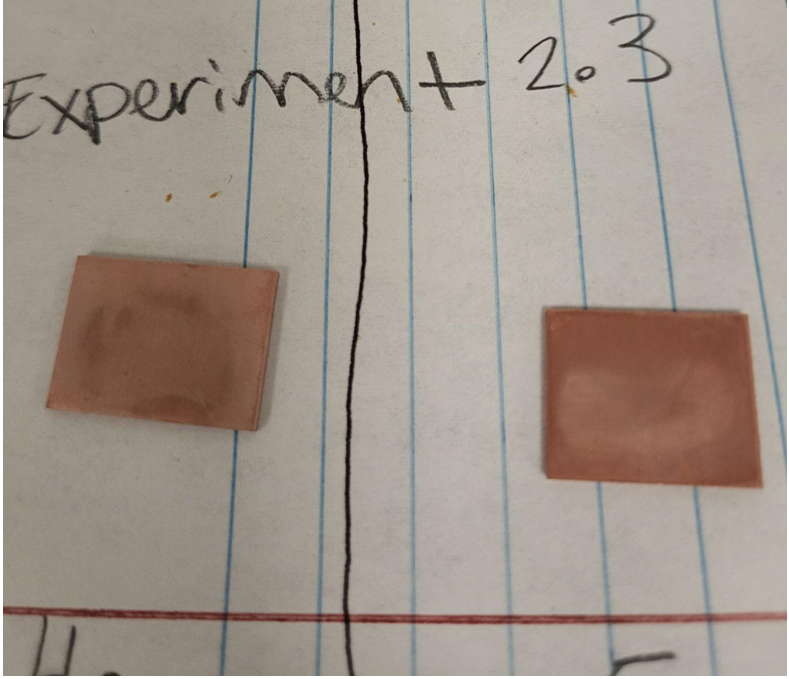 Figure 1: Copper samples after etching. Source: Seth Price
Ultimately, they would like to be able to predict the effects of the etchant concentration, temperature and time on the etch rate to develop a model for controlling how quickly material is etched.
Student experimental design
The students started out trying to determine the effects of time and concentration. They settled on two concentrations, at five times each. Then, they were going to conduct each of these at three separate temperatures. Originally, they wanted to perform a triplicate of each experiment, meaning 2 x 5 x 3 x 3 = 90 experiments. It was a noble goal, but an unrealistic one.
They started by etching samples at one concentration at five different times. They conducted this experiment twice and got nearly identical plots. Realizing the semester was slipping away from them, as the experiments are quite time consuming, they also collected one set of five data points at a second concentration. The results of the second concentration were clearly different from the first.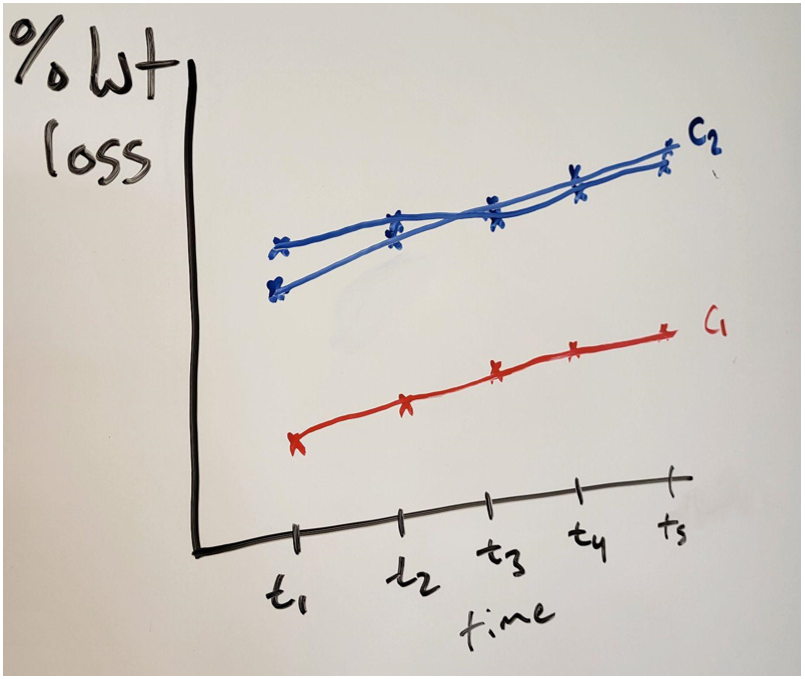 Figure 2: Qualitative graph comparing. Hand drawn to protect real data. Source: Seth Price
While the effect of concentration and time are shown qualitatively, more data is needed. Having tested only two concentrations, they cannot really model the effect of concentration. Temperature has not yet been addressed at all. How should they continue collecting data to make the most of their experiments and laboratory time?
Factorial analysis
One option is to use a factorial design of experiments. In this method, they could examine the effects of time and concentration together. The upper and lower bounds of each variable (time and concentration) are examined, as well as the center point for each.
If the students only got to conduct five more experiments in the lab, they could point to a trend, or where future work could be directed. While they expect longer times and higher concentrations to etch more material, this analysis would confirm it.
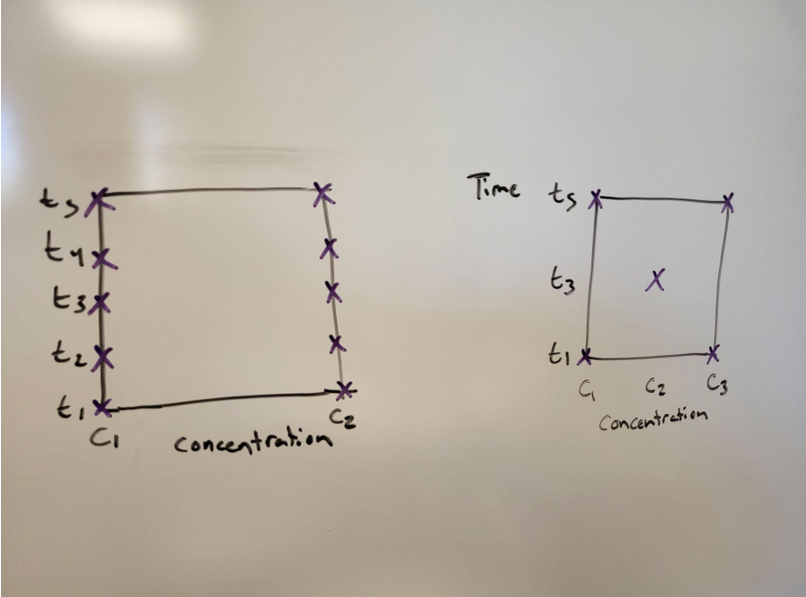 Figure 3: On the left is the data the students already collected. On the right is a factorial design. The students could take the center point and begin to establish trends. Source: Seth Price
After running the center point, they could go one of two ways with future experiments. They could run another set of five (one at each corner, plus the center), or even 10 (two at each). Then, each of these points could be compared to ensure consistency between runs. Graph all three trials at (c1, t5) together and see if they are close. Do this at each point.
Another option would be to narrow down the range. Instead of taking five more data points, they could pick the most interesting of the four quadrants and set up another matrix.
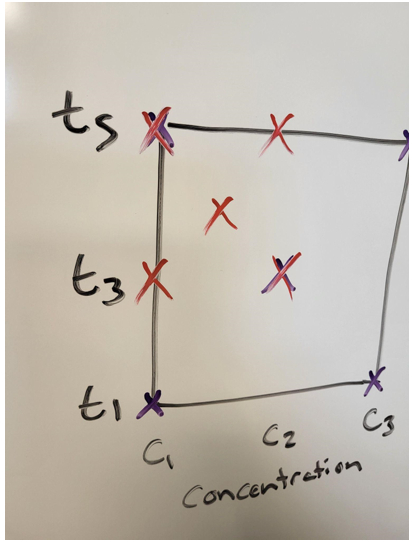 Figure 4: Narrow down the range and try again. Source: Seth Price
This is a good choice for when results did not match what was expected. The expectation is that the higher the concentration and the longer the time, the deeper the etch. However, suppose there was a maximum concentration after which etch rate does not increase. It might be worthwhile to narrow down that range.
To investigate the effects of temperature, the students could construct a 3D matrix instead of the 2D matrices shown above. Another way to look at this would be to choose one of the properties (time or concentration) and form another matrix plotting it against temperature.
They could also choose the variable that has the most effect, plotting it against temperature, while setting the least impactful as a constant. Ultimately, this will show how temperature impacts the etch rate. At the very minimum, students will be able to rank temperature, time and concentration from most impactful to least impactful.
Final thoughts
The biggest limitation is that real analysis requires a lot of data. Factorial analysis assumes linear, normalized data, captured accurately while controlling all important factors. However, those limitations aside, it can be used to identify trends and sensitivity to changing variables. It can help identify limits, where nonlinear etch rates along an axis may show valid operating ranges. For example, if the etch time only increases the etch rate up to a specific point, that point can be found by narrowing down the test range.
Overall, the collected data will be further analyzed by the outside contact. With this methodology, they can add to the data set, increasing the sample size for performing real statistical analysis. Building these test matrices will give them a blueprint to fine tune their desired outcomes.