

Improving yield is key to reducing manufacturing cost and maximizing profits in a highly competitive semiconductor market. While large yield limiters are addressed early in the process during yield ramp, subtle systematic layout patterns continue to cause physical defects throughout volume production.
The R&D teams from Siemens’ Tessent group and PDF Solutions developed a new approach that combines pattern analysis—FIRE from PDF Solutions—with volume logic scan diagnosis—root cause deconvolution (RCD) from Siemens EDA. The FIRE pattern analysis engine determines suspect groups of similar layout patterns (pattern families), the Tessent RCD diagnosis-based machine learning software then produces defect Paretos. These yield Paretos include specific layout pattern families as distinct root causes and show an overall increase in defect Pareto accuracy from ~70% to ~90%. Siemens EDA and PDF authors described it in an invited paper at the 2023 IEEE SPIE Advanced Lithography + Pattern conference and summarize the approach here.
Solving the problem of systematic failures
Failures during manufacturing can be classified as random or systematic, where systematic failures mean that certain characteristics, like the local geometrical neighborhood, determine the prevalence of failures. There are a few ways to target those neighborhood influences, but new or unexpected systematic failures can still be the main contributor to yield loss even at mature stages of modern technologies.
The next step forward in yield improvement is to identify those systematic failures. We need to identify failing patterns and to quantify their impact, but the methods available—SEM imaging and physical failure analysis—are time consuming and costly, need an a-priori information of the locations and can’t be applied to a large enough number in order to quantify the impact on product yield. We need a method that can quantify the impact of a pattern and can provide locations.
Here’s how we address this problem:
- Analyze the geometry of a product to define all locations where a failure can happen and build the patterns around these locations.
- Group the patterns into families, as shown in figure 1.
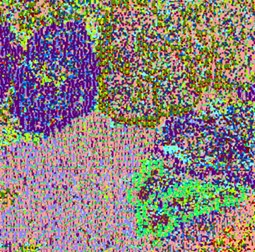
Figure 1: Pattern families on a flat layout after extraction and pattern analysis.
Using powerful tools: logic scan diagnosis software
Scan patterns generated by an automatic test pattern generation (ATPG) tool are the defacto standard in manufacturing test of digital designs. These scan patterns contain stimulus and known-good responses calculated by simulating the logical design. The manufactured design is tested by applying the design’s ATPG-generated scan patterns using automatic test equipment (ATE), which captures the failing responses. This fail data—scan patterns along with the logical and physical view of the design—are used by scan diagnosis software to produce a report, a process illustrated in figure 2.
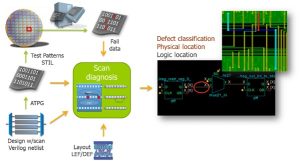
Figure 2: Typical scan diagnosis flow.
The typical layout-aware, cell-aware scan diagnosis provides information on location and physical properties that explain the failures. The reports guide failure analysis and yield analysis. Volume diagnosis, which is a large set of scan diagnosis, is particularly effective the test failure data is converted into a set of physical suspect locations for each failing die. For yield analysis, machine learning techniques like root-case deconvolution (RCD) help explain a population of volume scan diagnosis reports.
How to bring pattern family information into RCD analysis
We extended RCD to learn layout feature-driven systematic yield loss issues by combining it with pattern family data obtained from analyzing the design layout. The pattern family information comprises of a list of points with a location (x, y and layer) in the physical layout that is a potential defect location. Each point is given a pattern family and whether it could be an open or short.
The overall flow to import this information into volume diagnosis setup is shown in figure 3. The first step matches the point locations to logical nets in the gate-level netlist. This is a one-time setup step that gives the Tessent diagnosis layout database a map of every net segment and bridge location in the design to a list of potential defect location points on it.
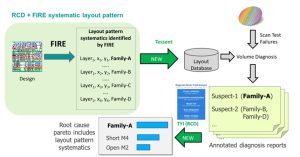
Figure 3: Layout pattern, diagnosis and RCD flow.
This mapping information is then used during diagnosis to annotate the diagnosis suspects with layout pattern family information. Finally, when learning from volume diagnosis results using RCD, the layout pattern families get added to the list of potential defect root causes that RCD must pick from when estimating the defect Pareto for a given failing die population.
Results of combining layout pattern families and RCD
There can be hundreds of thousands of layout pattern families in a modern design. Learning a defect Pareto from so many possibilities significantly increases the chances of converging on a wrong solution. To overcome this, RCD will intelligently filter out highly unlikely solutions and trim ‘tail end’ layout pattern families that are unlikely to be major causes of yield loss.
We tested this methodology in a simulated environment that creates populations of failing die based on a given defect Pareto. For every defect Pareto a few hundred defective dies were created by simulating injected defects and then diagnosing the resulting test failure logs. Finally, the volume diagnosis results were fed into the enhanced RCD learning and the estimated Pareto was compared against the starting defect Pareto to measure accuracy in identifying injected layout pattern families.
We repeated this experiment for seventy-two different populations to measure average accuracy across different defect scenarios. The results are documented in figure 4. This chart shows the average percentage of injected root causes correctly learned is 95%.
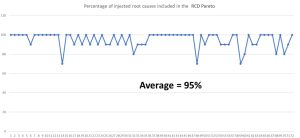
Figure 4: Percentage of injected root causes correctly learned.
Figure 5 shows that specifically for design systematic layout pattern family root causes, on average 3.75 of the 4.17 design systematic root causes were correctly learned. This data demonstrates the benefit of our methodology in determining previously unknown design systematics from manufacturing test data.
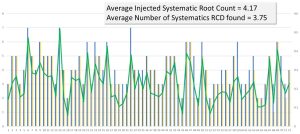
Figure 5: Accuracy of determining injected design pattern systematic root causes for various populations with different defect combinations.
Summary
Ramping and maintaining high yielding modern advanced process technologies continues to challenge the industry. Our new method helps uncover subtle defect modes where pattern systematics interact with designs to produce yield losses. The combination of effective layout pattern analysis (FIRE), logic scan diagnosis and RCD shows promise to uncover such issues without the need for extensive failure analysis. Using layout patterns and logic test failure data, the simulation results detailed above show high confidence (95% agreement) that this methodology can help in real manufacturing designs. We will continue working with partners and customers to validate the methodology with high volume data sets from production manufacturing layouts and diagnosis. Learn more about volume diagnosis on the Siemens website.
Authors
Manish Sharma and Jayant D’Souza, Siemens EDA
Hans Eisenmann and Thomas Zanon, PDF Solutions

Jayant D’Souza, Siemens EDA